What can we learn by examining their training data?

How this post came to be
It began as a happy coincidence. I landed a project dealing with cycling data and it was perfectly aligned with my passion for sports analytics. My interest in sports analytics also isn’t new; I’ve been in touch with the evolution of soccer analytics for years, ever since I first encountered David Sumpter’s Soccermatics in 2017 and the insightful work by Ted Knutson at StatsBomb. This made me wonder how cycling analytics compared to its more mature soccer counterpart. To my surprise, I feel that there is a significant gap between the two.
Seeing this gap, I believe there is a big opportunity for growth and innovation in cycling analytics, even though a lot is already happening behind the scenes, for example with WorldTour (WT) teams hiring data scientists. As a data professional and sports enthusiast, I wonder what can be done with data in cycling, and this post is my attempt of a first answer.
Soccer data abundance vs. cycling data limitations
When it comes to soccer, the landscape of data analytics is vast and rich. Resources and free data are abundant, enabling analysts to almost instantly play with stats, such as shots, passes, xGs, xAs, to only name a few. This wealth of data is partly due to soccer’s global popularity and the nature of the game with many player interactions during a match. In contrast, data on cycling races are often limited to basic final standings and stage profiles.
Cycling’s unique data treasure chest
However, cycling offers a unique aspect of data that soccer does not: training data. Have you ever seen Mbappé’s or Messi’s training data? Probably not, but with cycling, if you dig around a bit and have, say, a Strava profile, you can see what Evenepoel was up to in Sierra Nevada during altitude training for the Tour de France (TdF). Despite this, much of the data remains hidden as teams are understandably protective of their riders’ information to maintain competitive advantages. Even in limited forms, such data is a one of a kind opportunity to glimpse into the preparation and form of elite cyclists and young prospects.
In what follows, we will try to extract valuable insights from road cyclists’ ride data and see what it can offer.
Data
I scraped cyclists’ ride data from their public Strava profiles. I am well aware of the fact that by doing this I am on slippery terrain, but the curiosity just got the best of me. Simple stats, such as distance or elevation of each ride, were scraped. Since all analyzed riders are Strava subscribers and ride with power meters, we can obtain power curves of each activity as well. To calculate relative power curve values, their weights were taken from ProCyclingStats’ pages.
The choice of riders was random. They were the first ones I found with power curves displayed. I wanted to include a TdF participant, a young WT rider, and a couple of (very!) talented U19 cyclists.
The following riders were analyzed:
- Valentin Madouas, currently 28 years old, WT rider, former French national RR champion, TdF participant, all-rounder/puncheur type.
- Laurence Pithie, currently 22 years old, also WT rider, Giro participant, strong in flat and rolling terrain.
- Albert Withen Philipsen, currently 17 years old (turns 18 this year), the youngest rider to become a junior world RR champion, all-rounder, good in hilly terrain.
- Paul Fietzke, currently 18 years old, a talented young rider, good in hilly and flat terrain.
Activities from September 2023 to July 2024 were considered. Since Withen Philipsen has no listed weight, I used Pithie’s weight only because they are of similar height.
Comparing distance, elevation, and elevation per distance
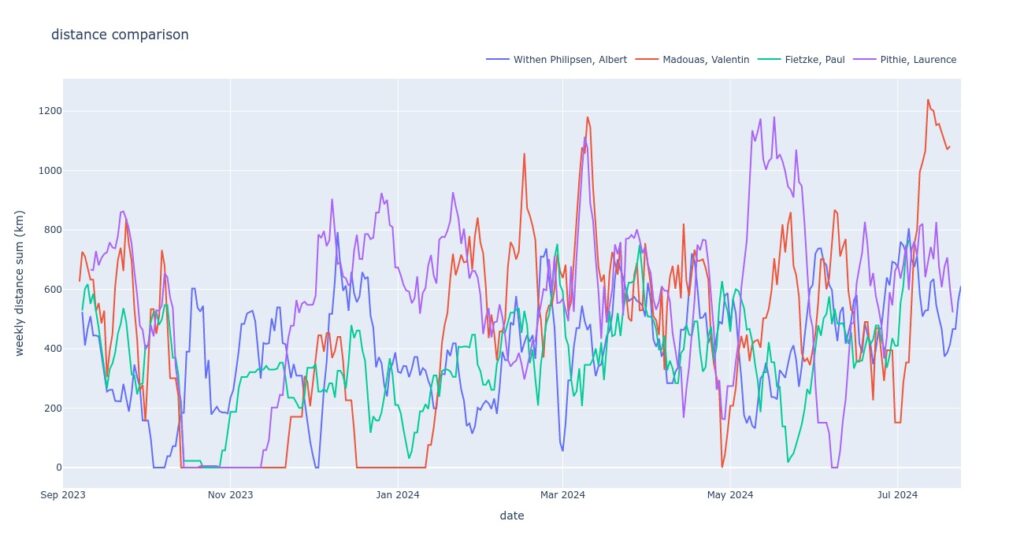
Let’s first compare the basic ride stats: rolling weekly total distance and elevation, and rolling weekly elevation per distance average, i.e. meters gained per km ridden. By comparing the stats for different riders, we could get answers to questions such as: Do Grand Tour (GT) participants train more than one-day race specialists? Do sprinters train differently than climbers? Do pro riders train more than young riders, and if yes, how much more?
One thing noticeable is that in terms of distance, riders cycling for WT teams ride way more than both U19 riders. The weekly total distance is not a flat line, but has oscillations corresponding to intense training periods, multiple-day races, and recoveries in between. Two GTs are on the chart: Pithie’s Giro in May and Madouas’ TdF in July. Younger riders cycle less. This is definitely due to shorter races and trainings, but it could also be influenced by different training type, since they both participate in other cycling disciplines, such as cyclo-cross or MTB. November seems to be a rest period for most riders, and is less apparent with younger riders.
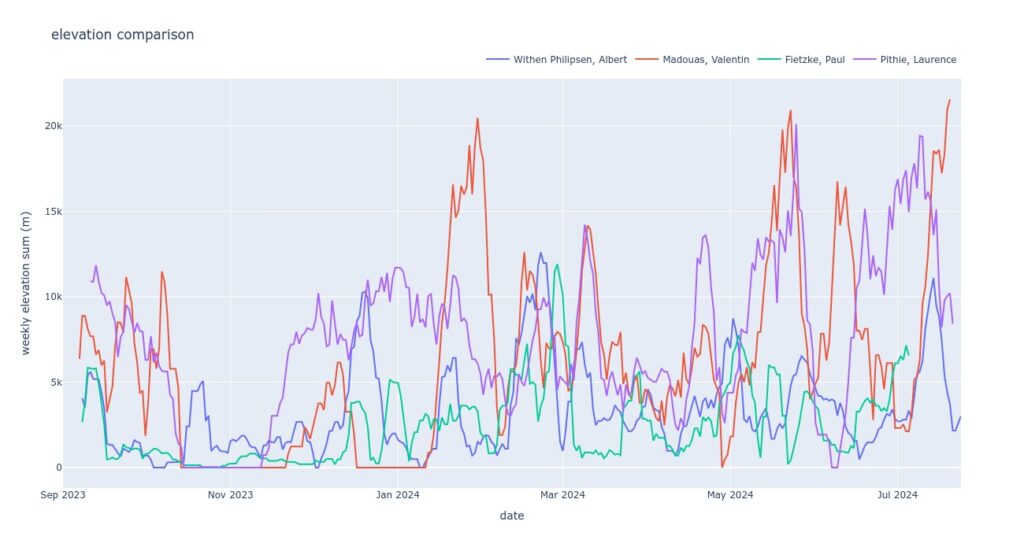
When looking at the elevation chart, the previously mentioned periodicity is even more apparent. What struck me the most was Madouas’ preparation for the TdF; the altitude gains were similar to the race itself and he did it twice in the same year prior to the big race. Pithie, for example, prepped for the Giro, but the elevation totals weren’t at par with the race itself. Perhaps this might have been because the training was not performed a month or two before a GT, but only a couple of weeks before. The younger riders have peaks corresponding to intense training periods, but they’re shorter in duration, say 1-2 weeks instead of 2-3 weeks.
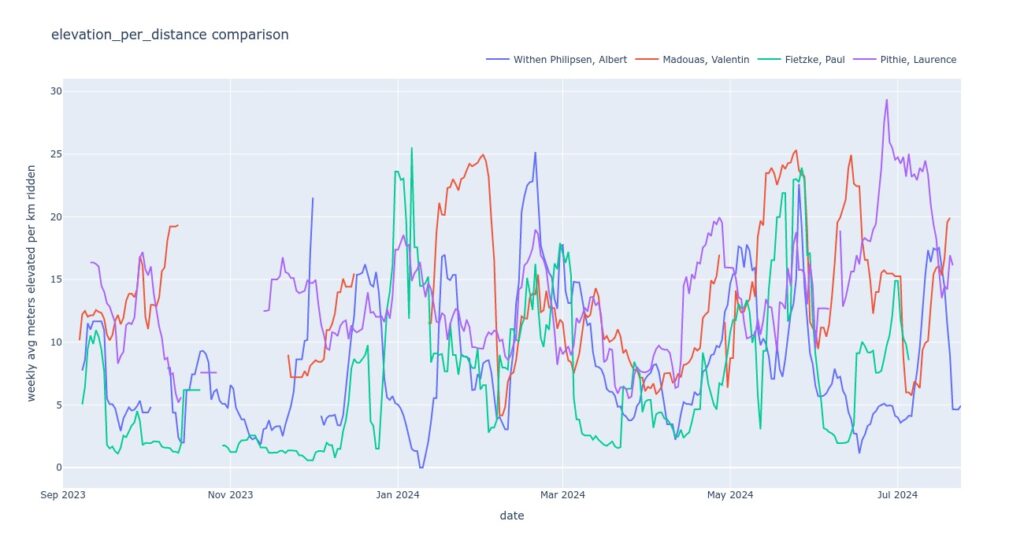
I also wanted to include the chart with average elevation gain per kilometer ridden. Here, we can see that both young riders can achieve similar numbers than the pros.
Power curves
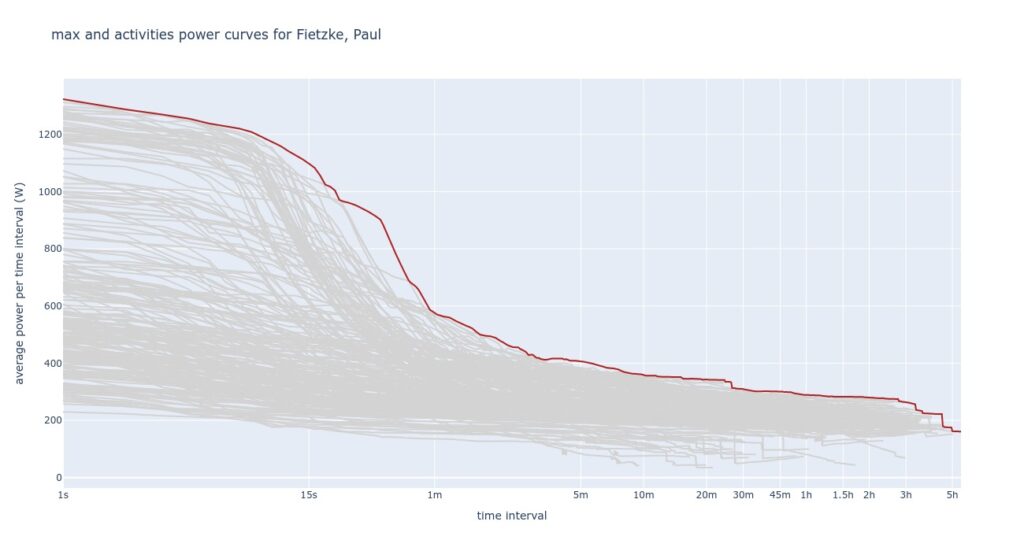
Each activity can have a power curve, but what we often call a power curve is a maximal power curve of all activities combined. In other words, max values of each effort duration among all rides are considered and displayed. Such a calculation can be seen in the chart below for Fietzke.
I know drawing conclusions based on four riders without a reference of what is decent or world-class makes little sense, but for the moment let’s put this concern aside. To begin with, I’m amazed by how outstanding Withen Philipsen’s numbers are in a lot of segments! Even Fietzke’s sprint power values top Pithie’s. Besides their talent, it could also be due to both U19 riders competing in other disciplines, where more emphasis is put on these intervals or are a by-product of a different training.
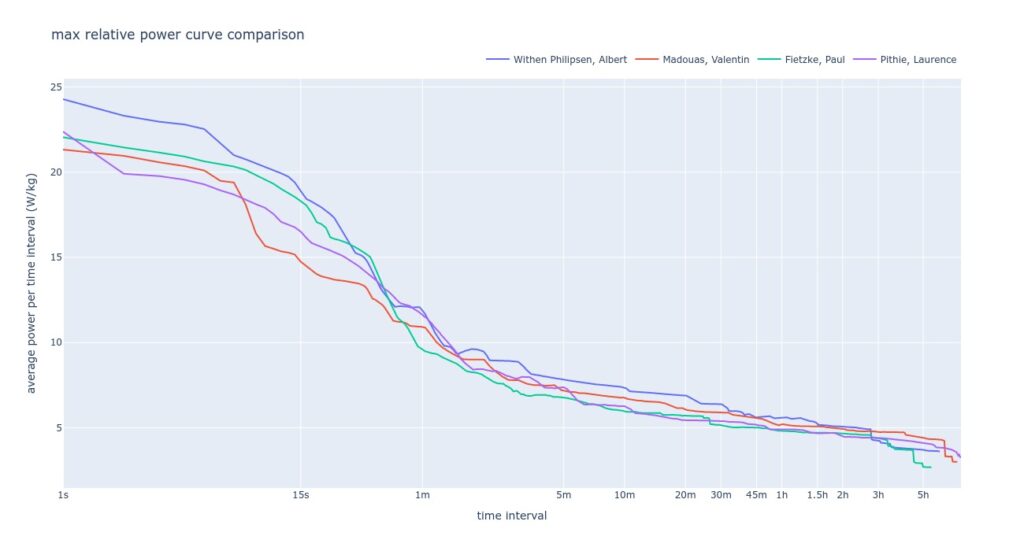
Where Pithie and Madouas stand out is long-duration efforts above 3 hours, proving that they are GT riders. Among the four, Pithie is competitive in the 30 seconds to 5 minute range, while Madouas above roughly 1 minute effort duration. While Withen Philipsen may win an intermediate sprint among these four after 50 km of flat racing, I’m not sure he would still be able to do it (or hold the pace for that matter) after an intense 4 hour race over hilly terrain, for example. It is deceiving that Fietzke’s numbers are the lowest above the 1 minute interval, since such relative power outputs still rank him as a world-class talent in his age category.
Conclusion
In conclusion, what can we do with data in cycling? Despite not emphasizing it in the post, my initial answer is: get data! It is not straightforward and it can take some time.
On top of some suggestions from the text, we could be doing much more with training data, and I’ll leave it to your imagination or my future posts for more. ☺️
On a more serious note, I’d state that someone with an experienced eye may have an idea of a rider’s form or quality by looking at basic stats. Comparing training load and current performance might help spot hidden talent and scout prospective riders, a practice which has taken off dramatically in the past couple of years when even teenagers sign future contracts with WT teams. One could also analyze competition in a race and devise a race strategy that will maximize the team’s chance of success.
All in all, the future of cycling analytics shines very bright and I can’t wait to see it unfold.
