In this post I would like to share an approach I use to backtest if a betting strategy or automated model performs profitably on past data or not.

You have this wonderful idea about how to finally make your betting endeavor profitable and you think no one in the history of mankind has ever thought of this genius concept (have we all not been there? 🙂 ) and there is no chance but to make money off of it. How could you prove that it works or not?
Usually what I start with is plotting profitability curves of a betting experiment and later performing a statistical test of some kind. In this post, I’m demonstrating the use of the former.
How likely is it that a betting strategy will start making profit as of today and has at the same time not performed well in the past? Unless you have some really good insider info, this is probably very unlikely. Therefore, we can take a strategy and backtest it on past data and assume it will behave similarly in the future.
For example, let’s see what happens if we bet on the underdog of every NBA game, underdog being the team expected to lose according to bookies’ odds. The following examples use a “unit betting” approach, which means that 1 unit is bet every time a bet is placed.
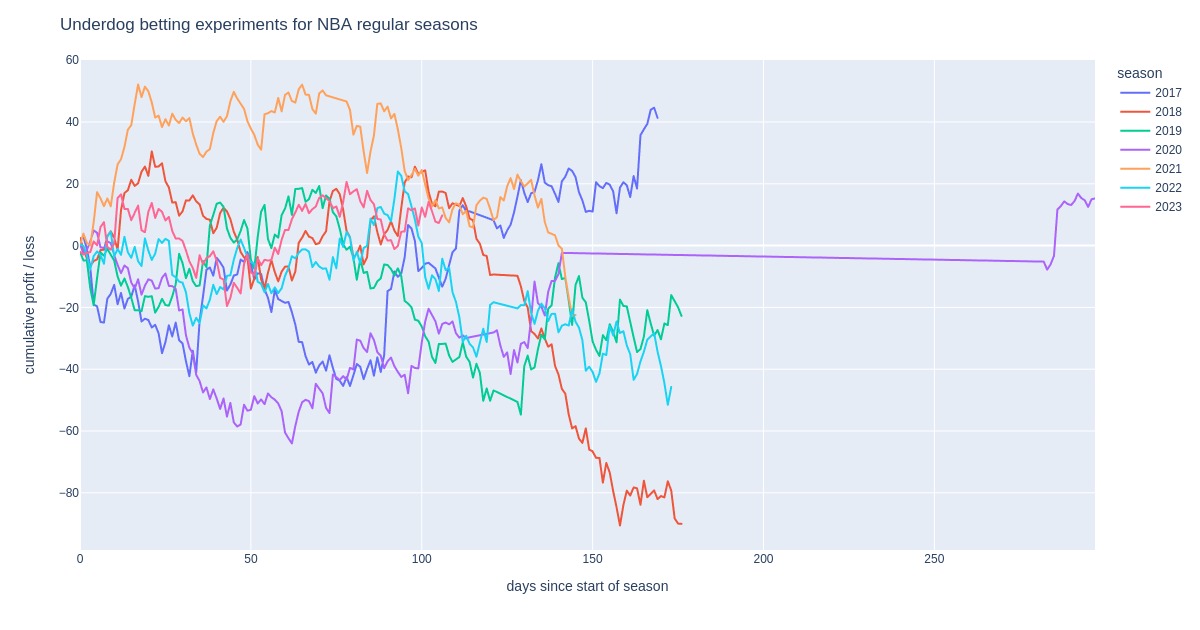
Looking at a concrete example, let’s say the Pelicans are playing at Nuggets. Decimal odds are 1.36 for a Denver win and 3.30 for New Orleans to win. In our strategy, we support the underdog New Orleans with 1 unit. When New Orleans loses, our loss is -1. On the other hand, if New Orleans won, we would have earned 2.30 units (3.30 winnings – 1 unit stake). We repeat this for all games and aggregate data per day. Results are plotted below.

A profitability curve tracks time dependency of cumulative sum of profits/losses for a particular betting strategy.
Looking at these curves for all seasons from 2016-2017 to 2022-February 2023, we can see that such an approach would result in a net loss in every season except 2016-2017 and 2019-2020.
An important quantity to keep track of in betting experiments is return on investment (ROI), which we define as net profit (or loss) of all bets placed divided by sum of all stakes. E.g. if a regular season has 1230 games and we placed a bet on all of them with a final profit of 41, the ROI is 41 / 1230 = 0.033 or 3.3 %. Positive ROI means profits, negative ROI is a loss.
ROI values for previous examples were 3.3 % for 2016-2017, 1.4 % for 2019-2020, and from -2 % to -7 % for the remaining seasons.
Can it happen that a bad betting strategy can result in a profit in a certain time interval due to volatility of results? Yes; I believe it was a coincidence that an underdog strategy performed well.
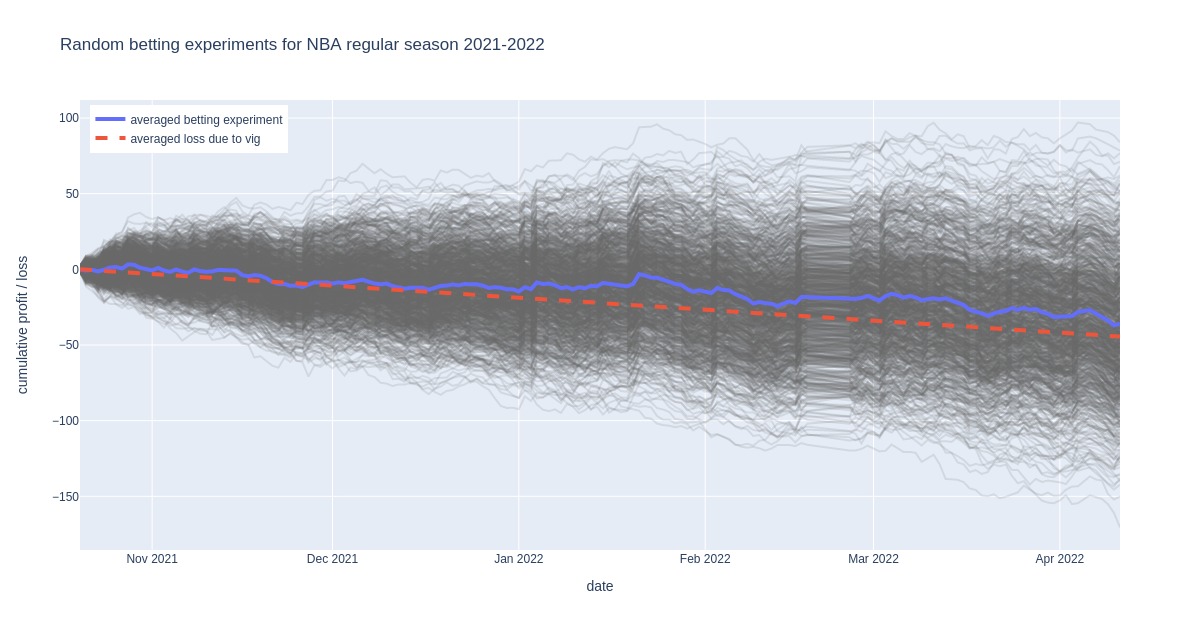
To further elaborate on this idea, let’s take random betting (all bets are completely random) and plot profitability curves for 1000 simulated betting patterns for regular season games of 2021-2022.

Gray curves are profitability curves for these simulations and the blue line is their average. It shows a steady decline in profits that is very comparable to what we would expect from a loss due to average bookie margin alone, shown by the red dashed line.
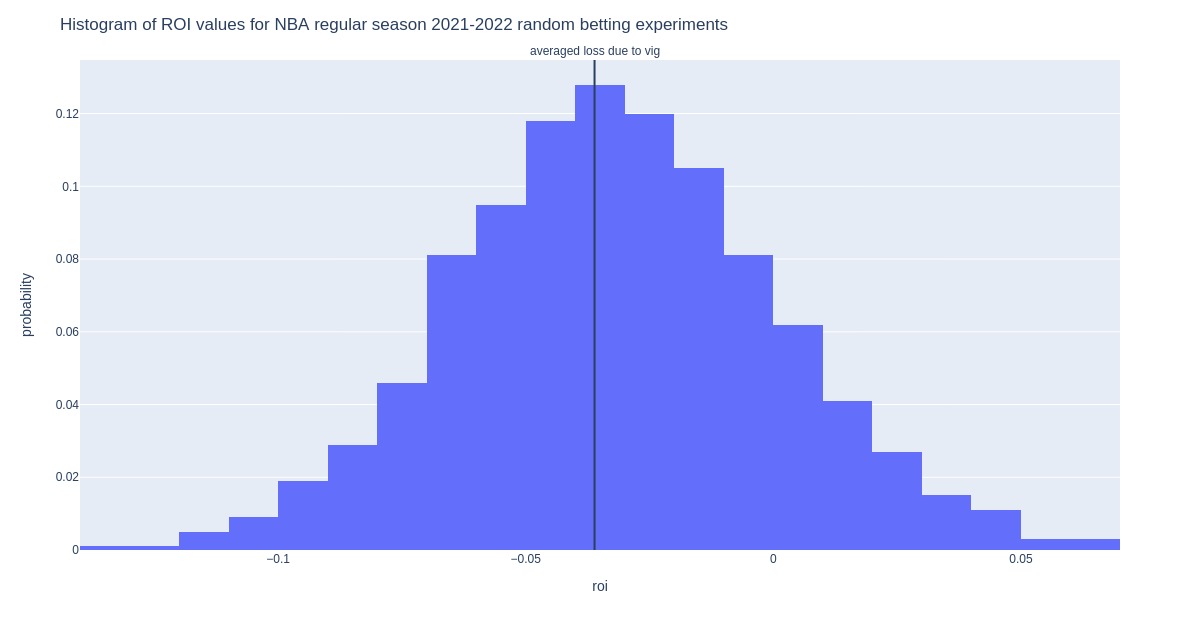
Similar values of average loss due to odds margin (-3.6 %) and final ROI of averaged random curve (-3.2 %) is a very neat side result of this analysis.
Surprisingly, some random curves end the season at a net profit. This means that a random betting strategy produced a profit despite the bookmaker collecting a vig on every bet! Let’s see exactly how often this happened in our set of 1000 experiments.

For the example above, this happened in 16 % of the experiments. Not a large number, but still way beyond what I was expecting.
The final punch of this post is that you can have a poorly performing good strategy or an excellently performing bad strategy. Or anything in between. Applying the same strategy for a longer time period will lower the probability of getting unexpected results, but it looks like one month is not a long enough period in the NBA to determine how a strategy performs.
Or is it?
