Short answer: somewhat yes, but probably not enough to bet profitably. Long answer: keep reading.

In this post, I’d like to show an example of using simple team statistics to predict NBA games’ outcomes. These predictions are coupled with scraped odds, and it is shown if such a simple method can earn you money in betting.
Game commentators often cite historical stats, for example, average given points in previous games, and use them to estimate how a player or team could perform on game night. Also, in the wilderness of the internet, sources are abundant with averages, rankings, and analyses. Why not ask ourselves how good this data is in predicting the winner?
My primary motivation for this analysis was to investigate if there is a way to automate game outcome prediction and betting. It is not a thorough analysis, merely a simple example.
Let’s start by using point averages and later expand to include more statistics.
Predicting an outcome using given and received points team averages
I calculated given and received point averages in three ways:
- as an average of all seasonal games played so far (SA),
- as an exponentially weighted average (EWA),
- as a rolling average (RA).
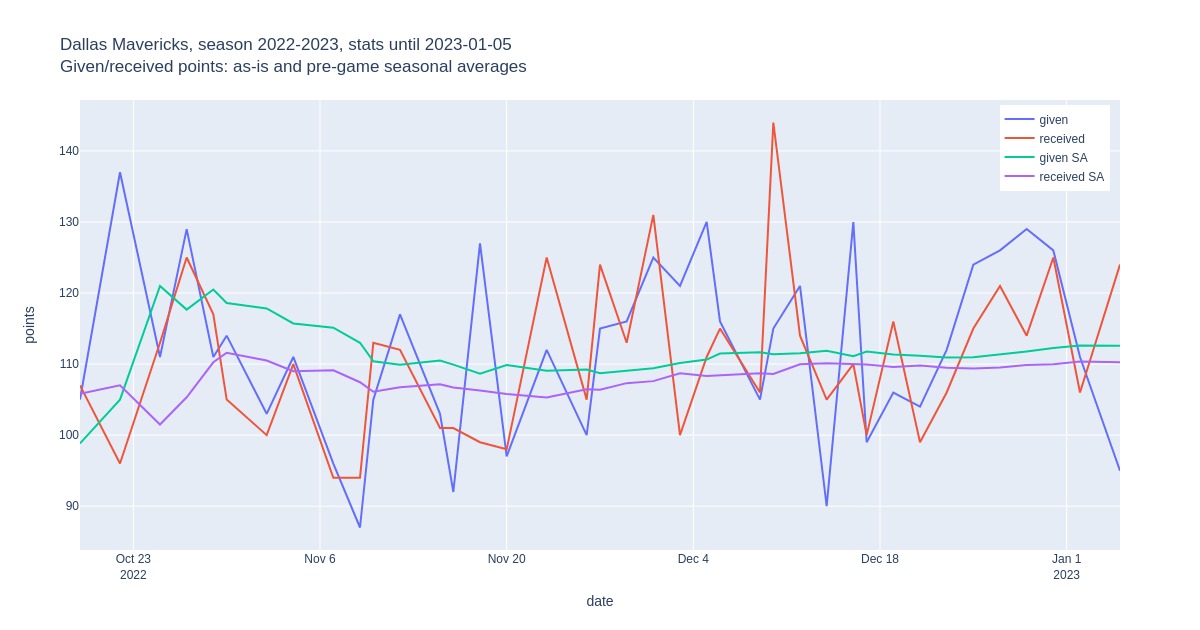
EWA and RA are used to test if there is any value in knowing recent trends. An example of the exact points scored and received, compared with seasonal averages, is given in the plot below. Note the significant differences between actual scores and calculated averages.

As a side note, only the same-season games were included in calculating averages. This reasoning comes from the fact that there is a long break between two seasons, players change teams, the coaching staff can change, etc., so a team from one season can be quite a different team in the new one. Nevertheless, this reasoning could be wrong.
Including only available seasonal games means that a third seasonal game with only two previous games and a twentieth seasonal game with 19 past performances have different amounts of past data, so averages in both cases won’t be similarly reliable. Still, it is all we can use.
Take a closer look at a Boston Celtics @ Dallas Mavericks game, played on 2023-01-05. The final score and calculated means are given in the tables below.
| Boston Celtics | Dallas Mavericks | |
| final score | 124 | 95 |
| SA prediction | 114.4 | 113.0 |
| EWA prediction | 114.7 | 114.5 |
| RA prediction | 115.7 | 114.7 |
| Boston Celtics | Dallas Mavericks | |||
| given | received | given | received | |
| SA | 118.6 | 113.3 | 112.6 | 110.3 |
| EWA | 117.5 | 114.6 | 114.5 | 111.8 |
| RA | 117.6 | 113.3 | 116.1 | 113.8 |
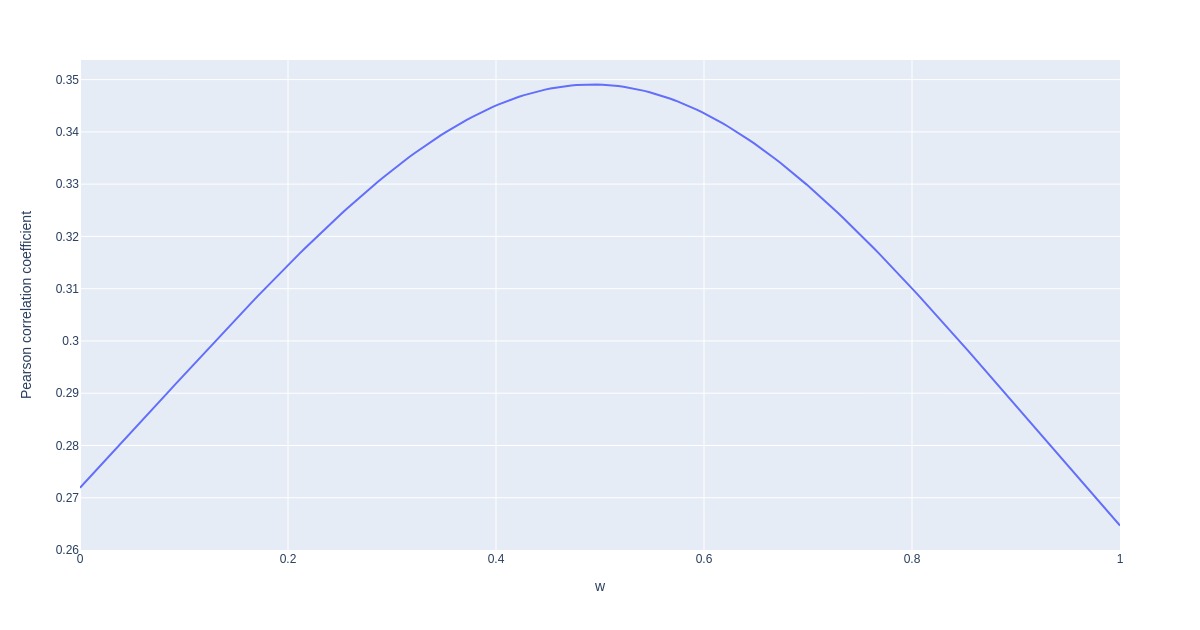
A question that pops out here is how to predict the Mavericks’ given points based on the values from the table above. It could be based on their given points, the Celtics’ received points or a combination of the two. On top of that, the outcome will be subject to substantial randomness. To resolve this issue, I calculated Pearson correlations between the actual points given and the linear combination ((1 – w) * SA points given) + (w * SA opponent’s points received). As you can see, linear combination includes both opponent’s means. Weight factor ‘w’ was varied between 0 and 1.

In our case, the maximum correlation is at w = 0.5. For the example above, this means that a SA score prediction for Dallas given points is 0.5 x 112.6 + 0.5 x 113.3 = 113.0, and similarly for other values. According to average predictions, this game should have been more balanced than it was.
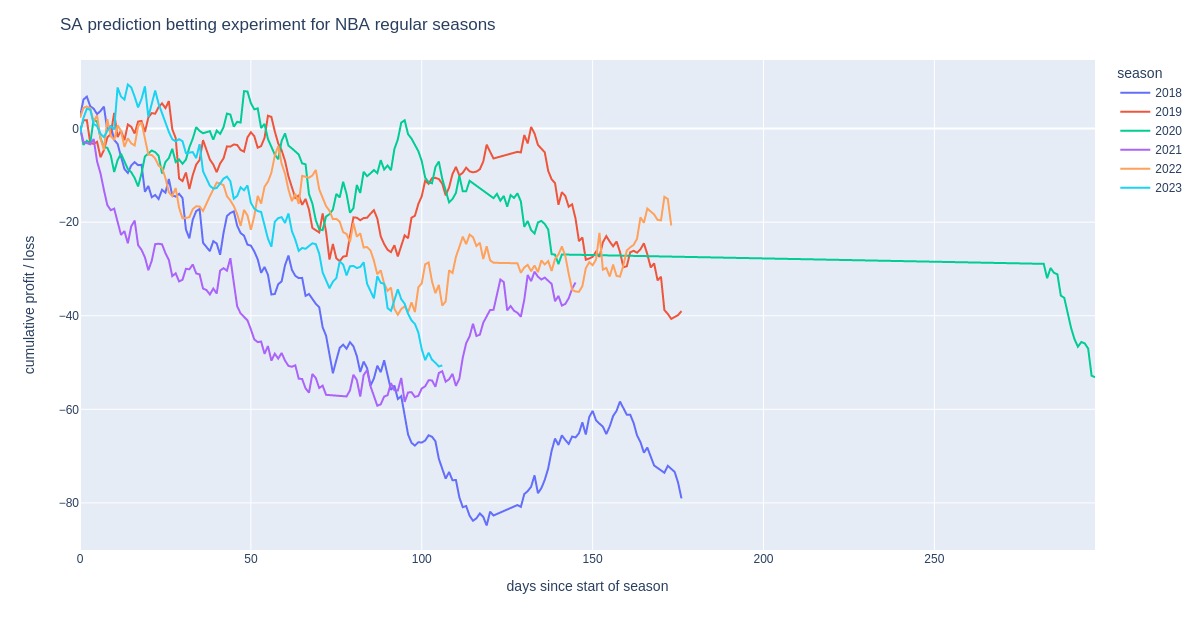
The above averages allow us to estimate the final score; whichever team is estimated to score more points is predicted to win. We can calculate a profitability curve when game outcome predictions are linked with odds. The resulting curves are shown below.

These predictions are somewhat valuable because the resulting ROI is comparable to losses due to bookie vigs entirely (stats method -5.3 % vs. bookie margin loss -3.8 %), but no, you won’t outsmart bookies.
On the other hand, EWA and RA perform better because they can follow seasonal changes to a certain degree. This type of weighted average is very much dependent on the recent opponents’ quality. E.g., if a team played against several bottom-of-the-table teams in the last rounds, the averages will be biased.
The following table lists prediction accuracies and ROIs for different approaches to calculating averages based on given and received points alone. A higher prediction accuracy does not necessarily result in a higher ROI, and I believe this is due to randomness and should not be the case with a larger sample.
| SA | EWA | RA | |
| prediction accuracy | 61.9 % | 62.2 % | 62.1 % |
| ROI | -5.3 % | -4.2 % | -3.4 % |
to February 2022-2023. Predictions were made on
points averages.
Using multiple statistics averages
Points scored are only a part of the team’s invested energy. A team can have a poor shooting night but still make up for it in defense. Rebounds, steals, blocks, and turnovers are also part of a team’s effort.
I took advantage of a little hack to include these stats and keep the section short. In daily fantasy basketball, specific stats are given weights, and you can express a player’s total output in fantasy points. Here, we described the team’s entire effort in fantasy points and reran the same calculation as in the previous section, meaning that given/received fantasy points averages were calculated. FanDuel metric was used to calculate fantasy points.
| SA | EWA | RA | |
| prediction accuracy | 62.1 % | 62.7 % | 61.6 % |
| ROI | -4.2 % | -3.4 % | -3.2 % |
to February 2022-2023. Predictions were made on
fantasy points averages.
As expected, results are better when averages are derived from fantasy points, but they still need more to be profitable.
Wrap-up
I’ve done similar analyses but have never thoroughly compared them with archival data and bookie odds to estimate profitability. My expectations for this study were low, but the achieved accuracy and ROI – despite a loss – of the RA model on fantasy points is above expectations compared to loss due to bookie margin. Accuracies are between 3 and 7 % worse than bookies and not too far even from some scientific research.
The approach is good, especially if you consider how much info is not yet included: lack of players playing a particular game, team and player form, managerial or roster changes, back-to-back games, the strength of schedule, etc. Profitability estimates could even be influenced by bookmakers’ odds placement strategies.
This analysis was my take on it, and you could do it in another way, limited solely by your imagination. But what more can be squeezed out of such an investigation? From my experience, no matter how much you wrangle team averages, it won’t be significantly better than the results above. A lot of information regarding the outcome is not given by averages, but this knowledge is included in odds, making it difficult to be profitable in the long run.
If you’d be interested in seeing how your custom strategy performs or discussing your profitable strategy based on past stats only, drop me a comment or send a message. It would be awesome to brainstorm on the topic.
The following steps in creating an automated betting bot are deriving more features and building some machine learning model on them. Stay tuned if you’re interested. Comments, ideas, and suggestions are always highly welcome!
